This tool is unprecedented in the REI industry for 3 Big Reasons:
- You can now find the median home value for any county, zip code, or neighborhood, with the click of a mouse.
- You can find HOT appreciating markets that have the lowest cost properties.
- You can price your deals better than competing investors in any market.
Locating the House Value Finder tool
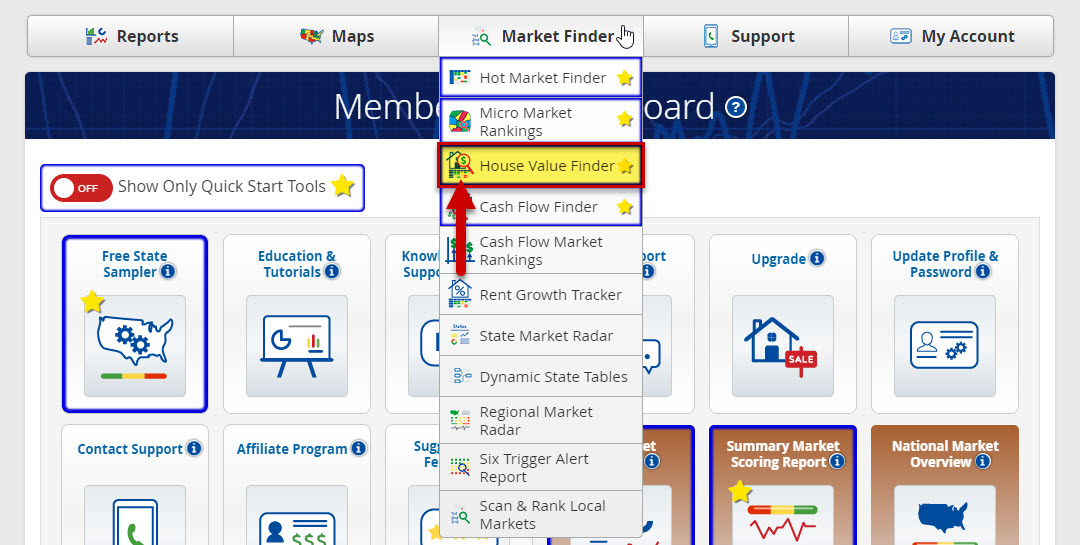
To find the House Value Finder, simply click on the Market Finder tab on the menu bar, and select House Value Finder from the drop-down list.
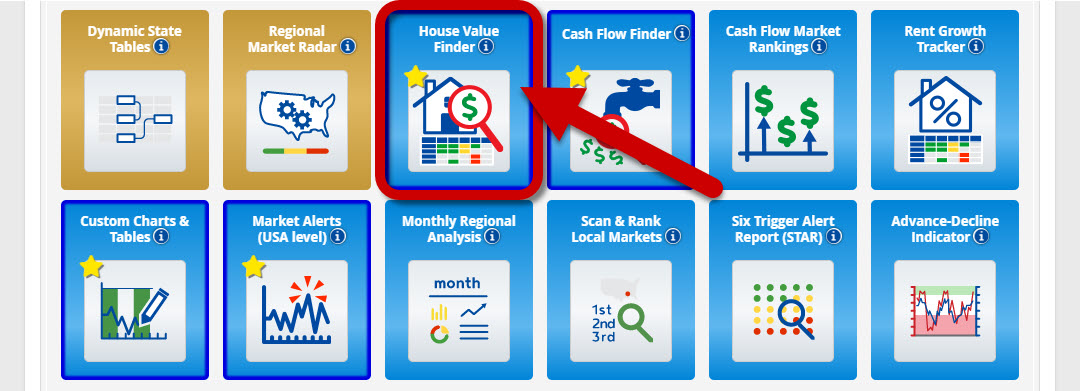
Or, you can locate it in the Dashboard (PRO section).
Using the House Value Finder tool
By default, the page loads with a ranked list of ALL the county markets within all the individual Cities and States within your subscription.
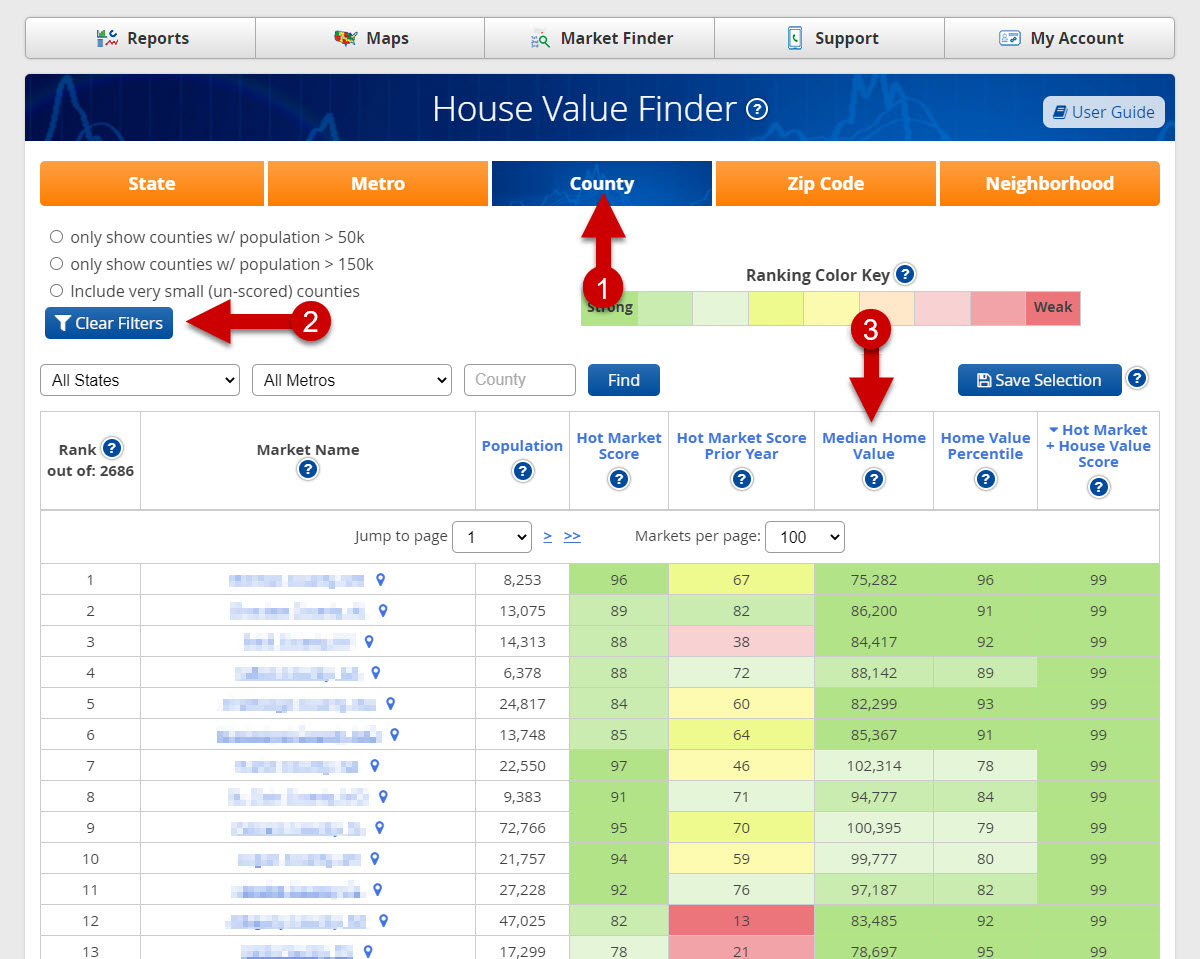
- Next you may select your market level from the provided options across the top of the tool (orange buttons).
- You can also change the population filters to narrow the listed markets to review a smaller cross-section of your chosen market.
- You can sort the list by any column you want by clicking the column title. The default is sorted by “Hot Market + House Value Score”.

You can also drill down within each 1Market Type you’re subscribed to, as well as 2SAVE your selections to your My Market Tracker.
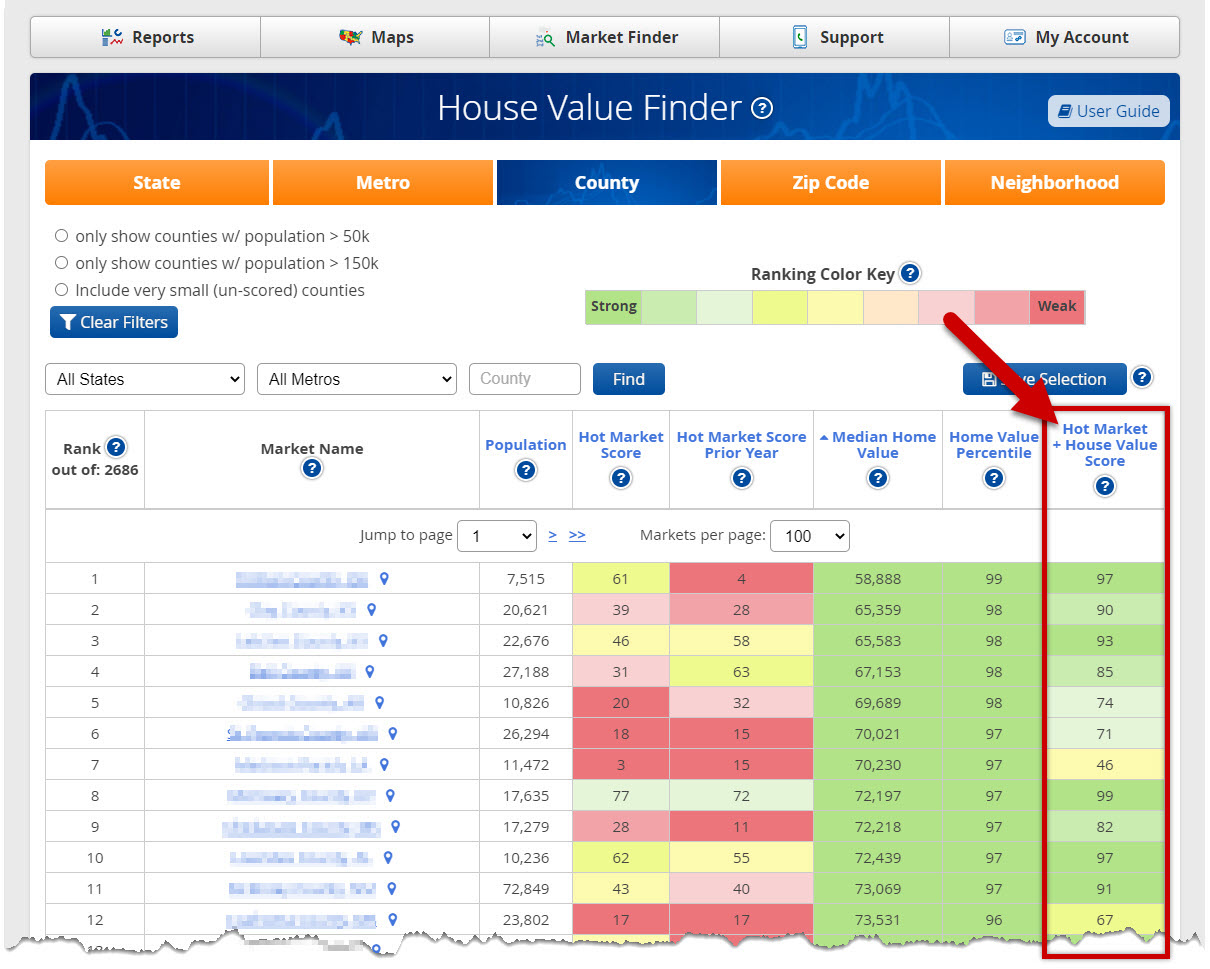
This indicator combines each micro market’s relative house value with its relative ‘hot market score’ to help identify potential counties, zip codes and neighborhoods with both lower priced properties AND a relatively higher potential for appreciation.
NOTE: This COMBINED score is subjective in that it gives equal weight to House Values and Hot Market Score. Use it as a ‘shortcut’ to filter through thousands of micro markets when searching for low property values AND some likelihood of above average appreciation. Click on the blue column title to rank the list by this indicator.
Now when you sort by Median Home Values, lowest to highest value, a handful of emerging markets show up in the Hot Market Score column.
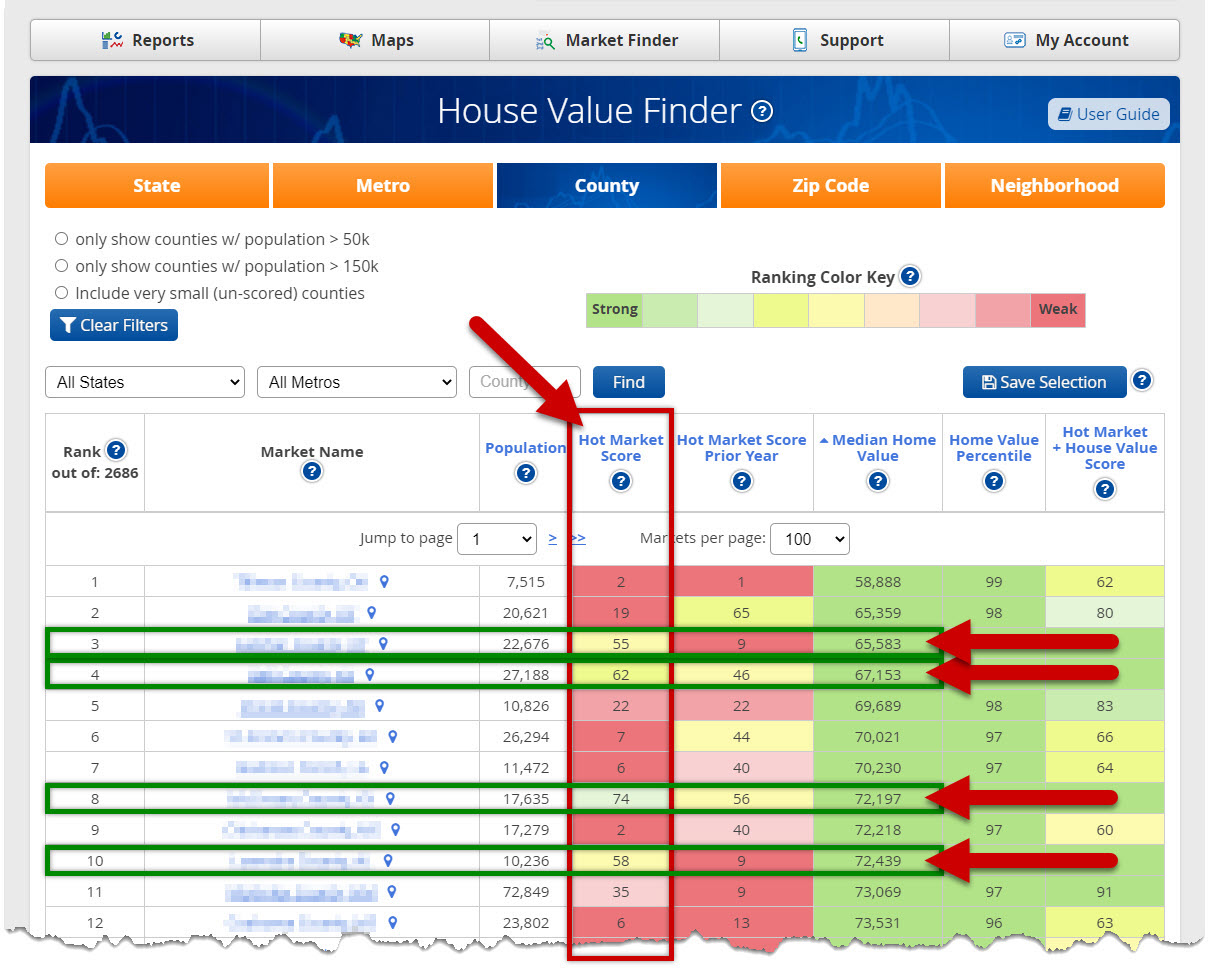
The Markets in positions 3, 4, 8, and 10 all have good or great emerging Hot Market Scores (This year vs Prior Year Hot Market Score), while at the same time being some of the cheapest markets in the country!
Those markets are your goldmines!
Why?
Because you can now target the lowest cost properties in the US that are in HOT and thriving markets!
This is unprecedented because you don’t need to compile heaps of data to uncover the most attractive investment markets for low-cost investors… we’ve done it all for you!
1) Find The Median Home Value For Any County, Zip Code, or Market Instantly
Investors often calculate the median home value of a county or zip code because they can get a baseline pricing index for deals in any given market… but now they can even find median home values for specific neighborhoods!
This means you’ll know exactly what homes should be selling for, before you decide to invest.
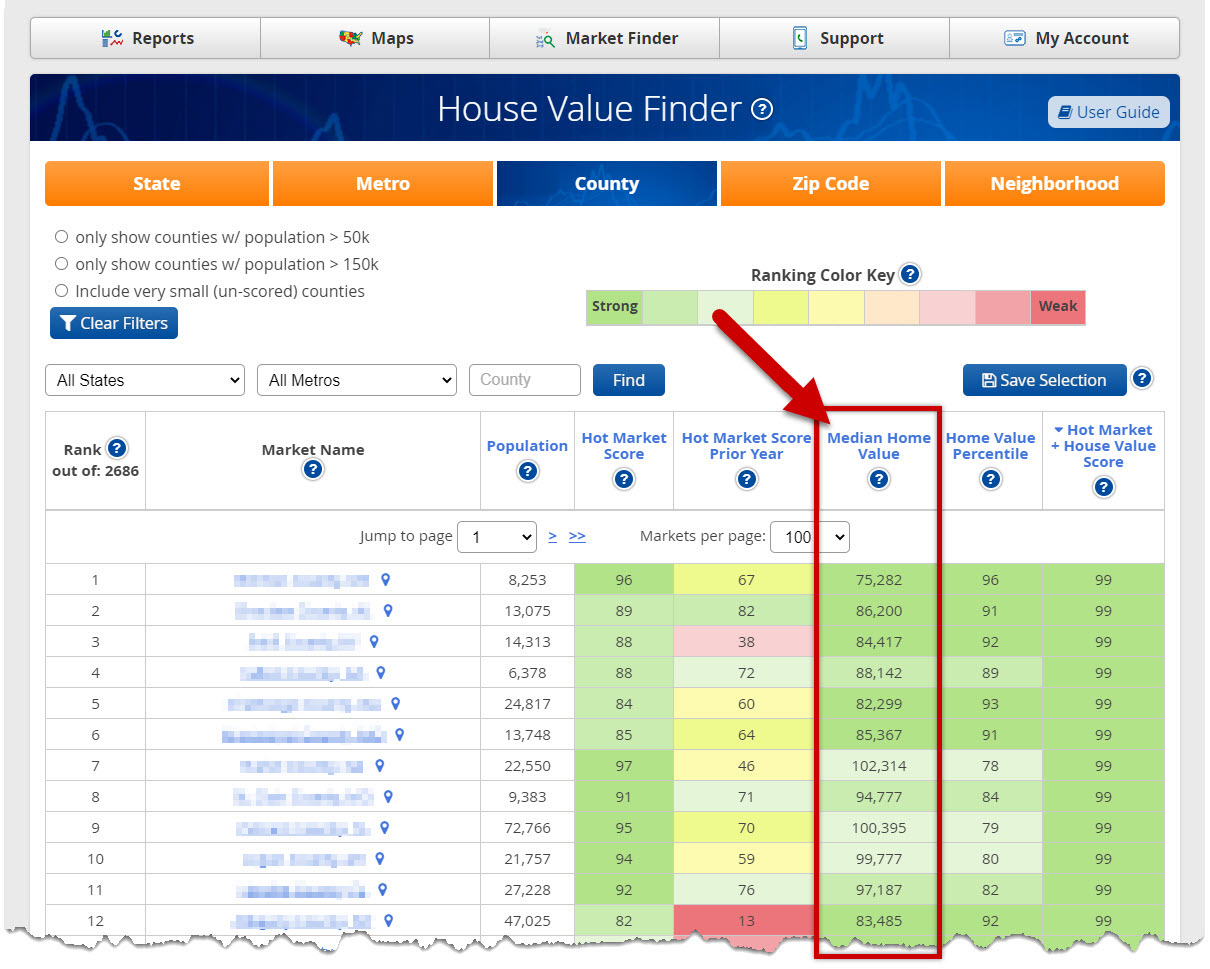
In the “Median Home Value” column, the median value is shown for a given market at the chosen market level.
2) Uncover Low Cost Properties In Hot Appreciating Markets
When we created the House Value Finder tool, we were fully expecting to see what we already knew- that lower cost homes (as a whole) are cheap because they’re in crummy markets.
We were right, but what we found is that there’s some markets that have BOTH low prices, yet are still in HOT appreciating markets!
Below you see a handful of markets that have both LOW Median Home Values and favorable Hot Market Scores.
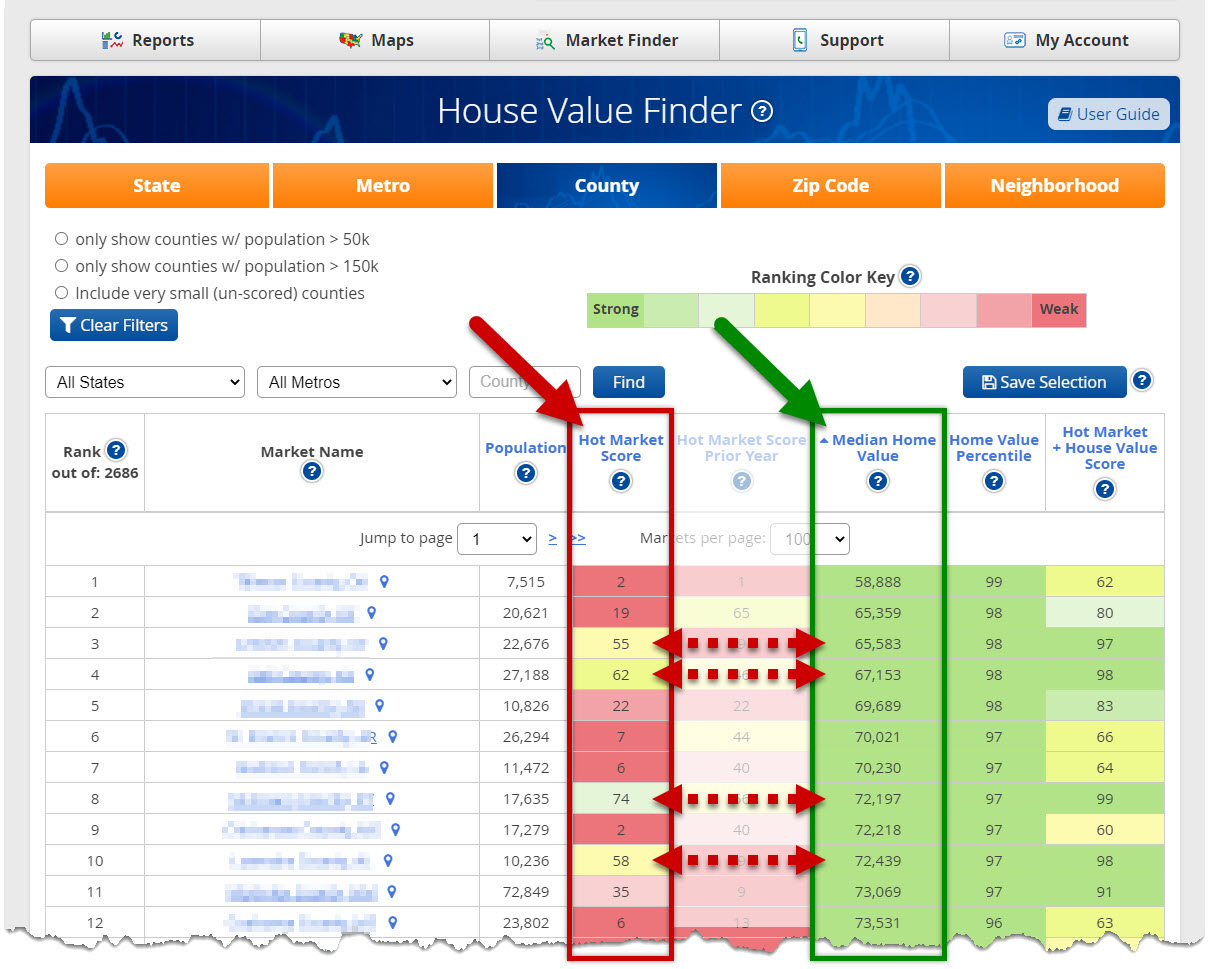
This information is a Gold Mine for investors… especially those that like to target lower-cost markets. With this new tool, you can now easily find LOW COST properties in HOT APPRECIATING markets, nationwide.
3) Price Your Deals Better Than The Competition
If you’re currently having a hard time finding good deals in your marketplace, it’s probably not because there aren’t any good deals to be had. There’s plenty of good deals, as long as you know how to price them.
For example, if you use a 35% discount rate as a baseline for investing, you have to first understand everything that’s going on with the micro market before you can decide if that discount makes sense or not.
In crummier markets where you’ll have trouble unloading your properties… you’re taking on greater risk. Therefore, you should try and acquire properties in crummier markets at a greater discount than the 35% example.
On the flip side- if you’re targeting properties in HOT markets, you can accept less of a discount in order to land your deals because your property will have a greater chance to appreciate (which is why you may see other investors scooping up deals in your area with less of a discount than you’ve been taught to be acceptable).
You’ve probably been led to believe that the discount rate is static, and can be used across all markets.
This is categorically false.
For crummier markets, you should consider getting more of a discount because you’re taking on more risk. For better markets, you can take less of a discount because you’re taking on less risk.
Here’s an example table that shows how you can use the Hot Market Score to price your deals:
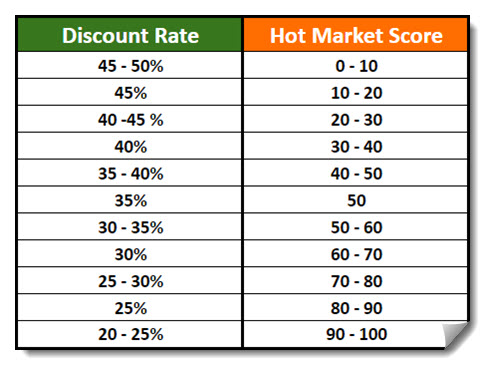
In the above example, the Hot Market Score on the right is providing an indication of what the discount rate should be expected on the left.
NOTE: This table is not a hard-and-fast rule. It’s simply showing you an example of how you can use the Hot Market Score along with the House Value Finder to make certain you’re getting enough reward for the amount of risk you’re taking on the property you’re investing.


