Click Here To Grab Your FREE Account NOW!
78 U.S. Markets Lost Value Year-Over-Year
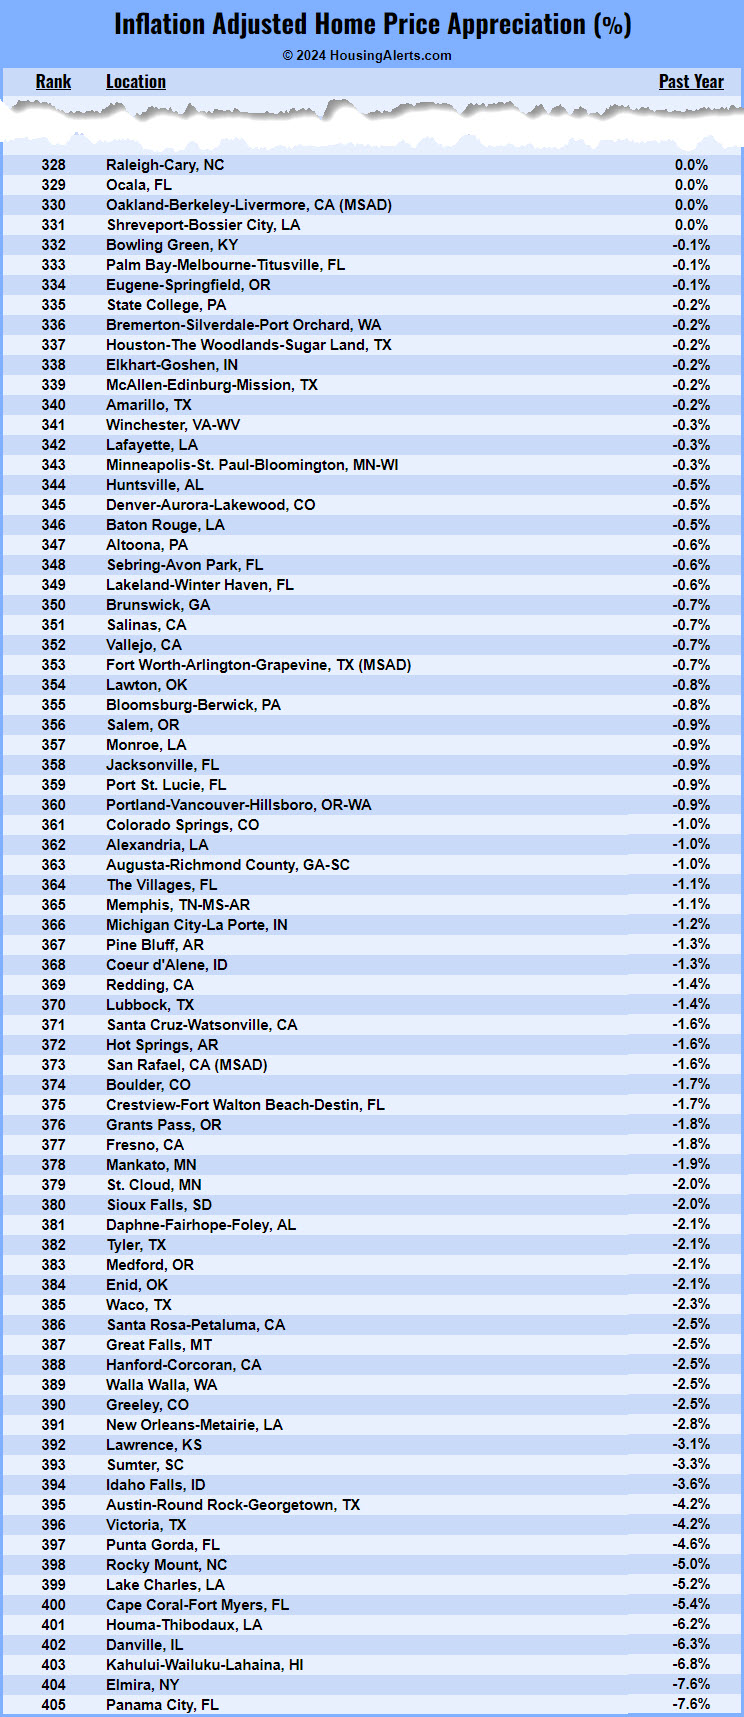
Last quarter, home prices declined Year-over-Year (YoY) on a ‘real’ (inflation-adjusted) basis in 78 (19.3%) of the 405 largest metropolitan real estate markets nationwide.
In the previous quarter, 88 markets had annual home price declines.
Surprisingly though, on a nominal basis, there were almost 50 major metro markets with double-digit annual home price appreciation last quarter.
It’s an especially complex time for real estate investors right now with hot market opportunities right next to many teetering markets poised to go either way.
Being in the right market at the right time, as always, will be the difference between winners and losers.
Check this out...
- Want to see into the future and learn how to be in the right market at the right time?
- Want to avoid the pain & expense of bad markets that suck the life out of you?
A good buddy of mine created a short 5 minute video how YOU can glimpse into the future to pinpoint the best micro markets!
It will change how you think of real estate investing.
Doesn’t matter how you’re connected or what you do…
- Wholesale
- Fix & Flip
- Buy & Hold
- Multi Family
- Tax Sales
- Raw Land
- Creative Financing
- Builder – Developer
- Agent or Broker
- Lease Options
If seeing into the future for your local real estate market would help you succeed, check out this video while it’s still up...
Below is the list of cities with
declining Year-Over-Year home prices…

HousingAlerts has been providing the most actionable, market-by-market decision triggers for every U.S. real estate market for 18 years running.
If your markets are on this list, DON’T panic!
ONE data point, whether it’s for a Quarter or a Year, doesn’t necessarily mean it’s time to buy, sell or hold… or do ANYTHING different, other than pay closer attention. That’s where Technical Analysis (TA) comes in.
TA is a 500 year old science to help predict future market swings. TA is used by every Wall Street investment bank and every global stock, bond, currency and commodities trading firm on the planet for TRILLIONS of dollars in DAILY trades.
We invented TA for local real estate
markets and have the most accurate local
market cycle predictions on Planet Earth
If and when any particular local real estate market starts to roll over and crash, you can see it from a mile away inside HousingAlerts.
If you want to maximize your Investing, Wholesaling and Flipping profits while minimizing risk, capital and effort in ANY U.S. real estate market, you need to invest WITH the market. Come join us and enter the world of Intelligent Investing.
We have been rolling out some amazing new micro market tools for Wholesalers and Rehabbers. Our Neighborhood Ranking tool alone should save you thousands a month in targeted acquisition and lead generation costs. Click here to buy now.


